INV-06 Inventory Turns
Turnover computed from outbound quantities over average on-hand stock.
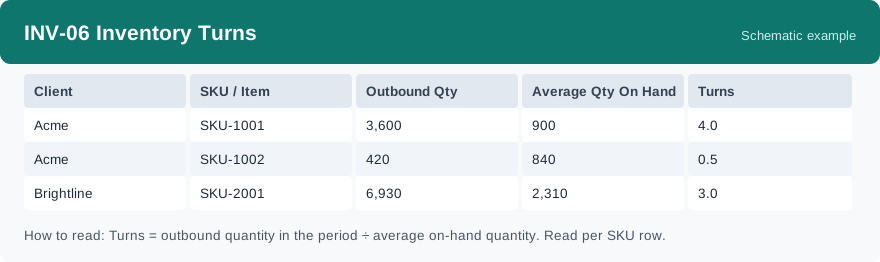
This report shows, for each client and each SKU, how many times the stock turned over in the period you pick, together with the outbound quantity and the average on-hand quantity behind that figure. It is built from a daily snapshot, so it is not live data — the results carry a small “data as of” note.
What this report is for#
Use it to see, for each client, which SKUs are moving and which are sitting still. A higher turns figure means the stock on hand shipped out more times over in the period; a low figure points to stock that keeps occupying space without shipping.
How the numbers are counted#
Turns = the outbound quantity in the period divided by the average on-hand quantity. The outbound quantity comes from the outbound shipment lines, and the average on-hand quantity is the average of the daily inventory snapshot. Outbound is attributed to a client through the outbound shipment header — the shipment lines themselves carry no client, the header does — so each client row counts only that client’s own shipments.
Dimensions and filters#
- Client — the client the row belongs to
- SKU / Item — the product
- Outbound Qty — quantity shipped out in the selected period
- Average Qty On Hand — average daily on-hand quantity in the period
- Turns — outbound quantity divided by average on-hand quantity
- Filters you can set: date range and client. This report has no warehouse filter.
How to read it#
Read one row at a time. Pick a SKU and look at its turns next to its outbound quantity and its average on-hand quantity: plenty of outbound against a small average means the stock moves fast; a large average with little outbound means stock is piling up. Compare rows over the same period, so every row is measured over the same stretch of time.
Typical uses#
- Monthly review with a client: walk through their fast-moving and slow-moving SKUs with outbound and turns side by side.
- Finding stock to clear or to stop reordering: a SKU with low turns over a long period is the first candidate.
- Checking the effect of a sales push: run the period after the push and see whether outbound and turns actually went up.
Report features used in this article: open INV-06 in Reports, set the date range and the client, and click Run; download the result as a CSV when you need it in a spreadsheet, or set up a subscription so the same view arrives by email on a schedule.
Note on subscriptions: your subscription and its filters are saved right away. Scheduled email delivery is being switched on in stages — sending starts as soon as delivery opens for your organization.