OPS-01 Picking Accuracy Report
Monthly picking accuracy by warehouse under the current accuracy definition.
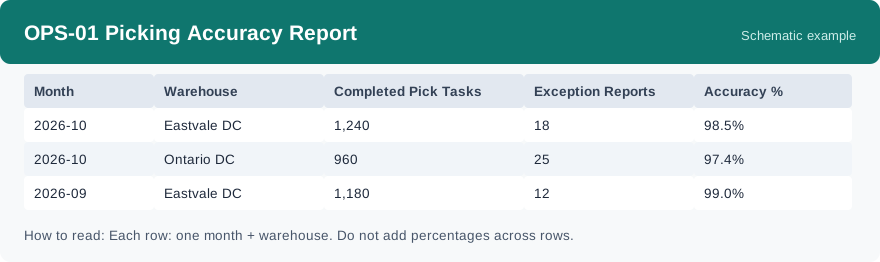
This report shows monthly picking accuracy for each warehouse: how many pick tasks were completed, how many exception reports came in, and the accuracy rate that follows. It is refreshed daily, so the current month grows day by day.
What this report is for#
Use it for the monthly quality review: is picking getting more accurate or less, and in which warehouse do exceptions cluster? It gives you one comparable rate per warehouse and month instead of scattered exception notes.
How the numbers are counted#
Under the current definition, accuracy = (1 − exception reports ÷ completed pick tasks) × 100, counted by month and warehouse. Exceptions are operation issue reports raised during the work. The percentage belongs to its own month row — do not add percentages across rows.
Dimensions and filters#
- Month — the month the row belongs to
- Warehouse — which warehouse
- Completed Pick Tasks — pick tasks completed in that month
- Exception Reports — operation issue reports in that month
- Accuracy % — the accuracy rate for that month and warehouse
- Filters you can set: Date Range, Warehouse
How to read it#
Each row is one month in one warehouse. Read the three numbers together: completed tasks set the scale, exception reports are the problems found, and the percentage turns them into one rate. A small month can swing on a handful of exceptions, so compare the rate together with the task count, not on its own.
Typical uses#
- Review picking quality month by month in the operations meeting
- Compare warehouses and find where exceptions cluster
- Check whether a picking change improved the rate the next month
Reports features used in this article: pick this report in Reports, set the date range or warehouse filter and click Run to see the result; use Export to download the result as a CSV file; or use Subscribe to have the same view sent to your inbox on a schedule. Your subscription and its filters are saved right away, and scheduled email delivery is being switched on in stages — sending starts as soon as delivery opens for your organization.
How this differs from OPS-06 Operations Exception Report: OPS-01 turns exception reports into a monthly accuracy rate per warehouse, while OPS-06 counts exception-related actions one by one. Use OPS-01 to judge the rate, and OPS-06 to see what actions were taken.